Using data to take your marketing and branding efforts to the next level

Most Destination Marketing Organizations (DMOs) today rely to some degree – if not a great extent – on traditional survey research. Surveys enable DMOs to ask tailored questions to a targeted demographic, resulting in meaningful insights. Surveys are, and will continue to be, an important component of marketing and branding strategies.
Meanwhile, in today’s world, we find ourselves awash in data beyond just survey research. From a DMO’s perspective, it can feel overwhelming to make sense of what data to use, how to analyse it, and how to take action on it. But it is actually quite feasible for DMOs to leverage data in powerful ways by putting it alongside existing traditional survey research to gain deeper insights, helping their destination become more competitive.
Among all the public data available today, what can actually help move the needle on a DMO’s marketing and branding efforts? Social media is among the most plentiful and insightful – there is obviously vast chatter about places on platforms like Facebook, Instagram and Twitter. In addition, niche sites like Trip Advisor, top travel blogs, and the many other places where travellers and influencers live online represent rich sources of information.
And it’s not just about the relevance and amount of data you analyse – it’s about the frequency. Whereas a traditional survey gives you a snapshot in time and are generally too costly to perform more than once a year, data streams allow you to understand your destination’s perception and reputation as it evolves over time. You may know how favourably people view safety and security in your destination, but how is that sentiment trending, and what is driving that trend? Knowing the answers to questions like these gives your place an edge.
If you haven’t yet made data insights part of your marketing efforts, what’s the best way to start? Take your survey data – or any other point-in-time information source that is currently informing your marketing efforts – and use it as an initial reference point. Then, begin to introduce insights from other data sets – perhaps social media first – to calibrate your strategy. This makes your static data “come alive,” giving your DMO a much more precise understanding, in near-real-time, of your location’s perception, brand and reputation.
Now that you’ve got analysis and insights on your data, how do you make sense of it and figure out what’s actionable? Start with a data visualization platform, the centrepiece of which is a dashboard depicting the indicators the DMO feels are most important. Dashboards allow the DMO to quickly distil and grasp the takeaways from significant amounts data. Depending on the DMO’s needs, these tools can be customized to incorporate things like visitor surveys, and other internal or external data sources.
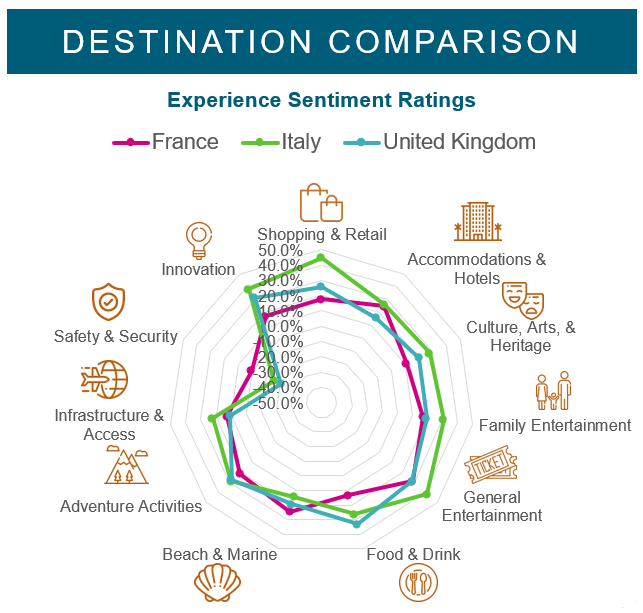 To illustrate, let’s look at some specific analysis on France, the world leader in inbound arrivals. In the dashboard component shown here, France only appears in the top five among EU countries for one of our 11 experience indicators – Safety & Security. Although it does not appear at the top list for most experiences, France has ample opportunities to grow. For example, it gets 13% of travellers, but 11% of receipts. By comparison, the UK gets 5.6% of travellers yet rakes in 9.9% of receipts, revealing that France is leaving significant amounts of money on the table. (Source: TravelView Destination Brand Assessment, 2019 Europe Report)
DMOs are always looking to get the most out of their marketing spend. Next time you’re looking for a cost-effective way to give your place an edge, don’t forget about the power of data and dashboards.
Jason Kemp is the Founder and CEO of Skylight Intelligence, a technology-enabled managed services company that serves the Fortune 500 and Travel & Tourism and Place Branding industries.
.